Activity 01
Process
| Assigned | Due | Submit |
|---|---|---|
8/27/26 |
9/1/26 |
Introduction & context
The cartographic process consists of many distinct parts, from data observation and collection to analysis and design. In this activity, you’ll find a dataset, consider its process, and make some quick maps with it. You’ll read/skim some writing by people who think a lot about cartography/mapping so that you have more context for the process.
You’ll ultimately submit a map, and because this activity is a little more substantive than typical mapping activities, it will be worth 6 points instead of 3 points.
Data Is Plural
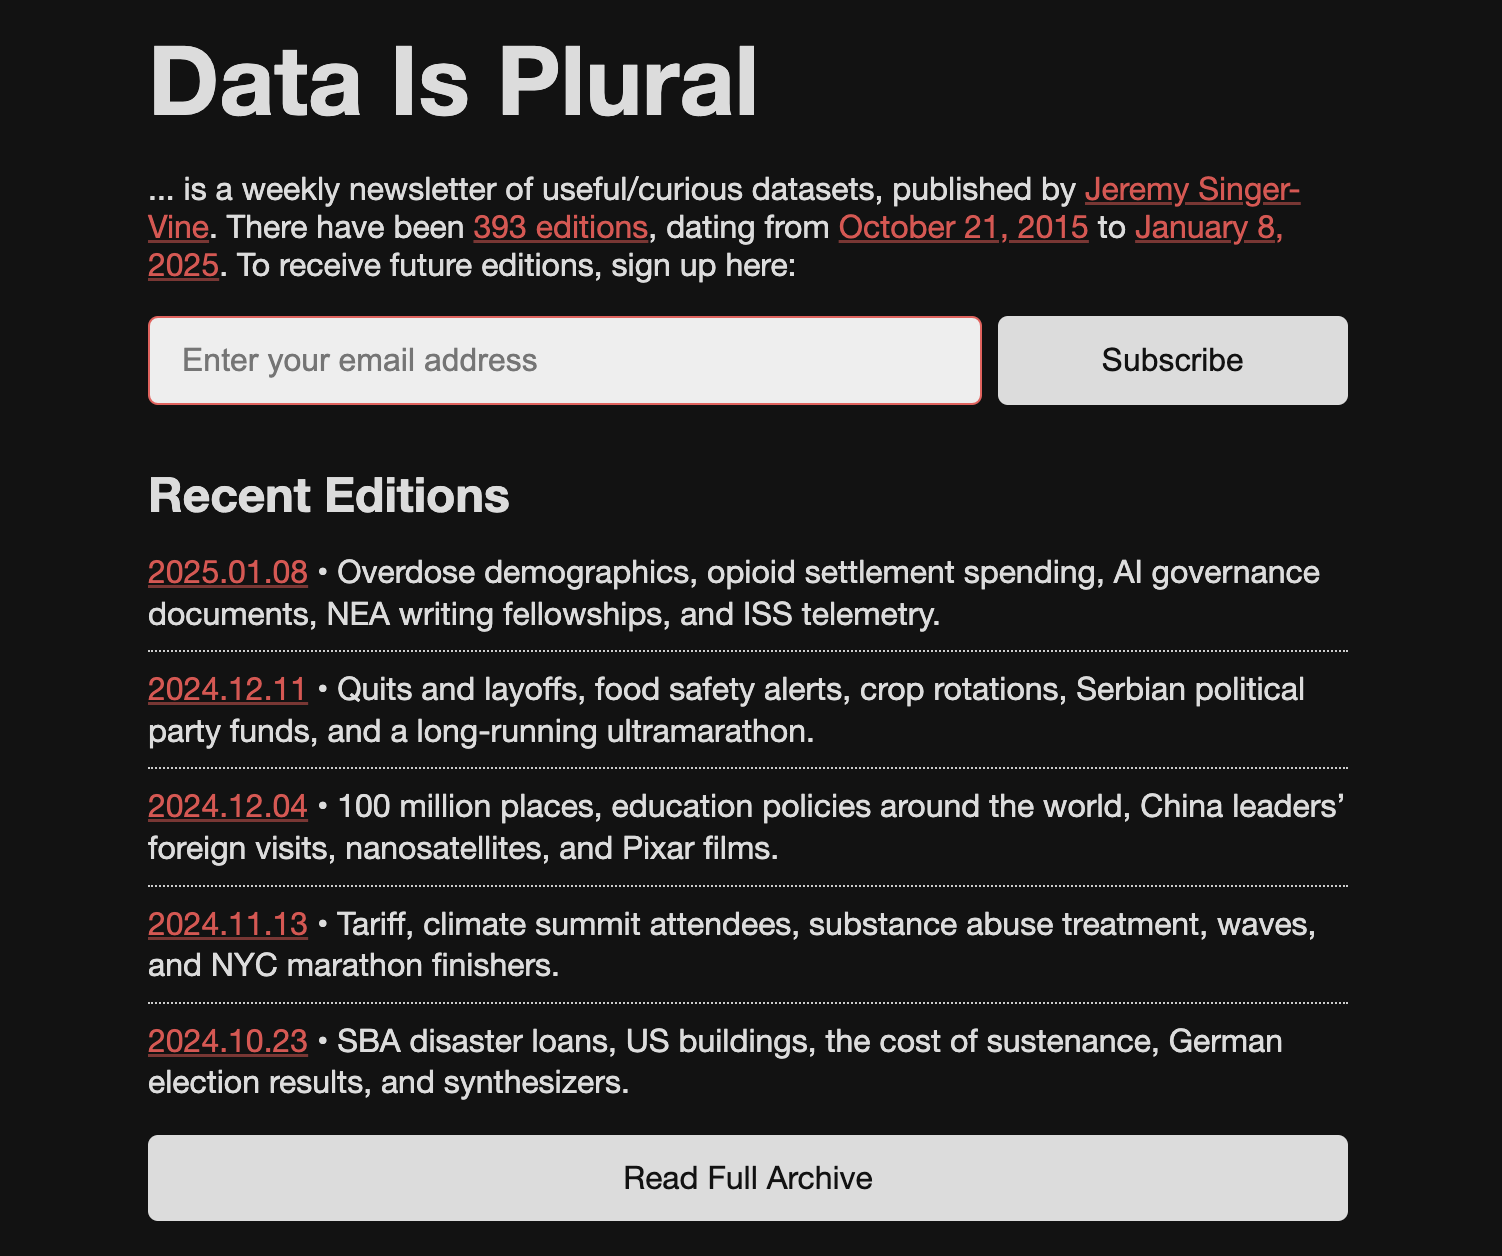
Since 2015, Jeremy Singer-Vine has published Data Is Plural, which he describes as “a weekly newsletter of useful/curious datasets.” He has archived every newsletter, each of which which contains multiple datasets, for a total of 1,995—a number I can only tell you because he has published a dataset about his dataset, which is to say, a metadata-set. Thanks, Jeremy!
Pick a dataset
Head to the Data Is Plural website and poke around. Look at old datasets, look at new datasets.
Identify one dataset that you find interesting and has meaningful spatial attributes. To do this you’ll probably have to download a few datasets and open them in Excel so you can understand their contents (and figure out if the data is actually interesting/mappable).
Y’all probably know this but if you’re provisionally downloading a bunch of datasets on computers in the SAL or Jepson that you don’t know if you’ll keep, feel free to tuck them on the C: drive or Downloads folder for initial exploration. It’s only when you start loading them into Arc projects etc. that you want to make sure they stick in hemisphere.
Explore the data
Load your dataset into ArcGIS Pro. Most of these datasets will be tabular datasets with lat/long coordinates, so you’ll probably have to do a little XY plotting. And you may have to do some basic data crunching/reformatting before you can get it into Arc.
Make some notes (you’ll use these later!!) about the following questions:
- Who made it?
- How was it made?
- What it describes (e.g., important fields/properties in the data)?
- Its temporal and geographical extents?
- Using this data, what’s a research question that you could ask?
Make a map
Now, open a new ArcGIS Pro project—do create a workspace on hemisphere first—and make this data into a simple map.
In lecture, we talked about maps as being selective, symbolized, and generalized. Consider these fundamental elements of the map while you decide what features should be included, how they should be symbolized, and how detailed they each need to be.
As you mapmake, document each step of your cartographic process. This means writing, like in a journal or some such, about what you are doing with the software and why you are doing it (you’ll use this later!!).
This documentation should actively reflect on your process, each step of the way, so that you notice the choices you may not normally consider. Why did you pick this color palette and not that one? Why do you adjust line thickness here, point size there? How (quickly, slowly) and where (on a phone, screen, paper) do you anticipate your audience will read this map?
Requirements
Your submission should meet the following data, layout, and design specifications.
Data
Data-wise, your map should include:
- The chosen Data is Plural data, symbolized appropriately. You could show them as points, heat map, graduated symbols, etc… if you’re feeling crazy, you could even aggregate them up to some unit (hex tesselations, census blocks, whatever)
- Necessary boundary features—you’ll need to download these separately
- This week, you can include the standard ArcGIS Pro base maps if you want, but note that in future weeks, you will not be allowed to use these! Making base maps is excellent practice.
Layout
In the map layout stage, include:
- A title
- Cartographer information (name, date, class)
- Data sources
- A short block of text (let’s say 1-2 paragraphs) included somewhere in the map layout, where you document your cartographic process. This block of text should synthesize the notes you took
Design
Do your best to make these maps look good to your eye. Today, design with your gut. Think what makes a good map to you, intuitively. Think about what you liked in the maps that you found for the questionnaire. Maybe look at some other maps that you admire. What makes them work? Or maybe look at a map that you do not like. What makes it not work?
I’m specifically avoiding more details on how to lay out this map because I want to benchmark where you’re all coming from in terms of cartographic design. Feel free to zhuzh these maps up as much as you want or keep them pretty minimalist. Whatever you decide to do, bear in mind what we discussed in lecture:
- Cartography is an art, so try to make it look nice (intentional use of color, fonts, etc.)
- Cartograhpy is a science, so follow best practices in data presentation (appropriate projections, etc.)
- Cartography is a matter of power, so consider what arguments—on purpose or unwittingly—your map is making
Submission details
| Assigned | Due | Submit |
|---|---|---|
8/27/26 |
9/1/26 |
Submit your map to Canvas as a .pdf.